


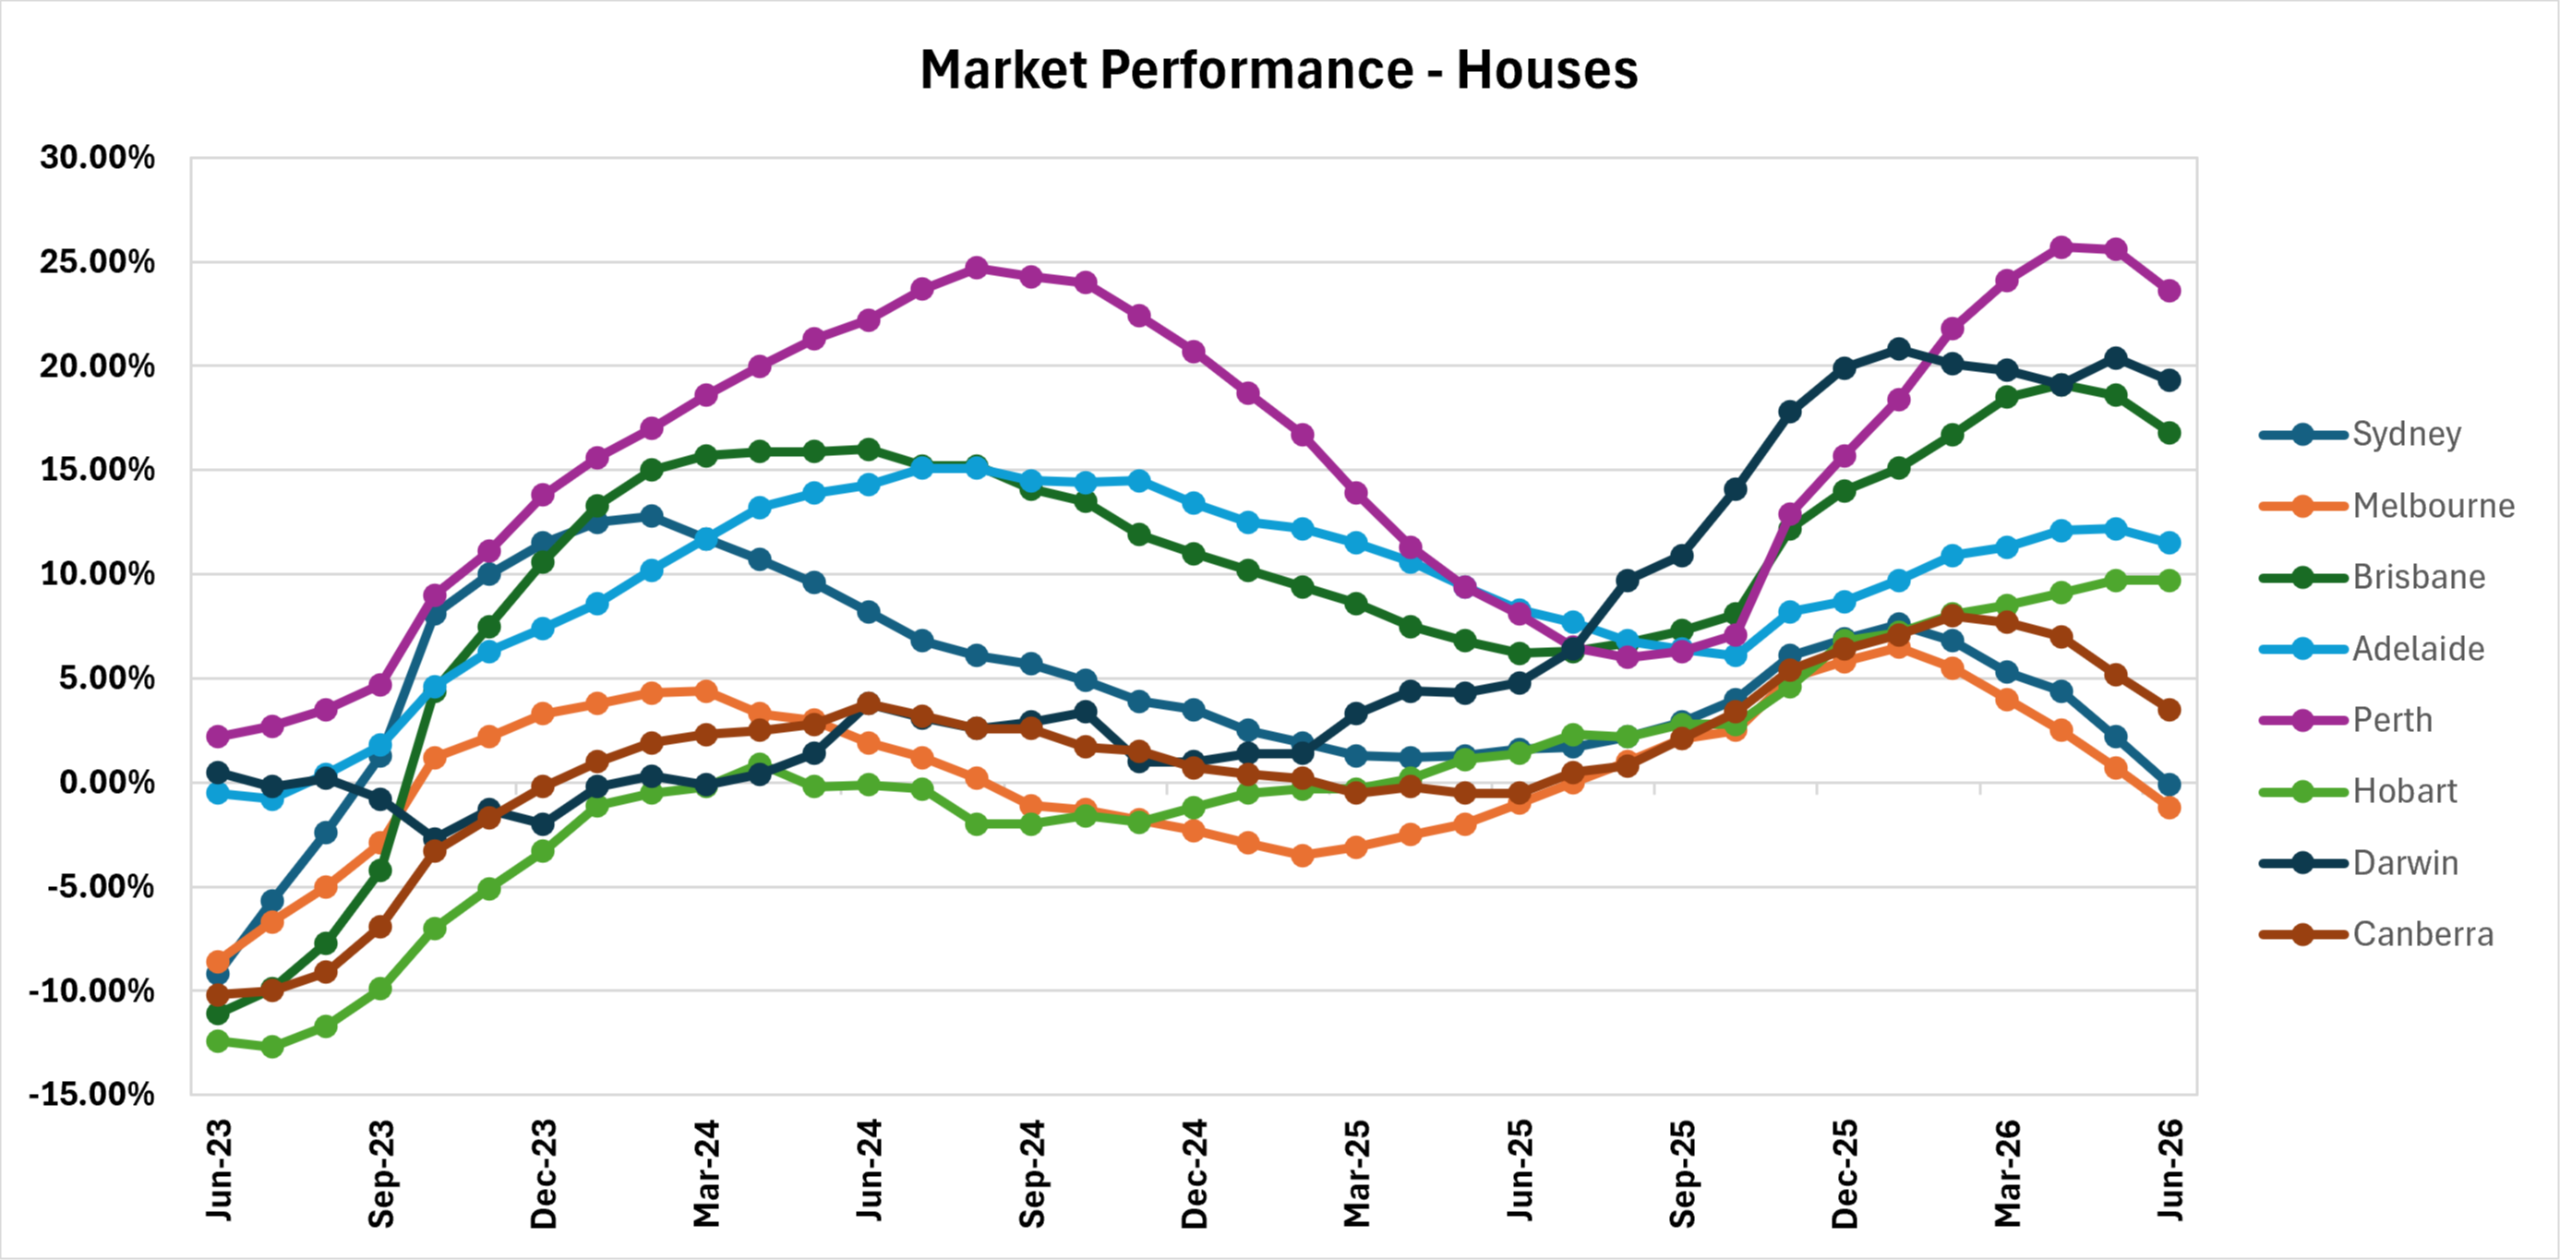
Price Trend Line = Houses v Units
The graphs above represent a trend line of the median price performance at capital city level. Source = Cotality. Note the above graphs don’t represent ‘prices’ but show ‘price changes’ over time.
Houses – The detached housing market continued to demonstrate a clear divergence between Australia's capital cities during June. Perth remained the standout performer, recording monthly growth of 0.7%, while Darwin (1.2%) and Hobart (0.6%) also posted solid gains. Brisbane recorded a modest increase of 0.2%, with Adelaide holding steady over the month. In contrast, the larger eastern capitals experienced further weakness, with Sydney (-1.5%) and Melbourne (-1.3%) recording the largest declines, while Canberra eased by 0.7%. The results suggest that affordability constraints and market confidence are continuing to weigh on the higher-priced markets, while more affordable areas of the property market continue to benefit from comparatively stronger underlying demand.
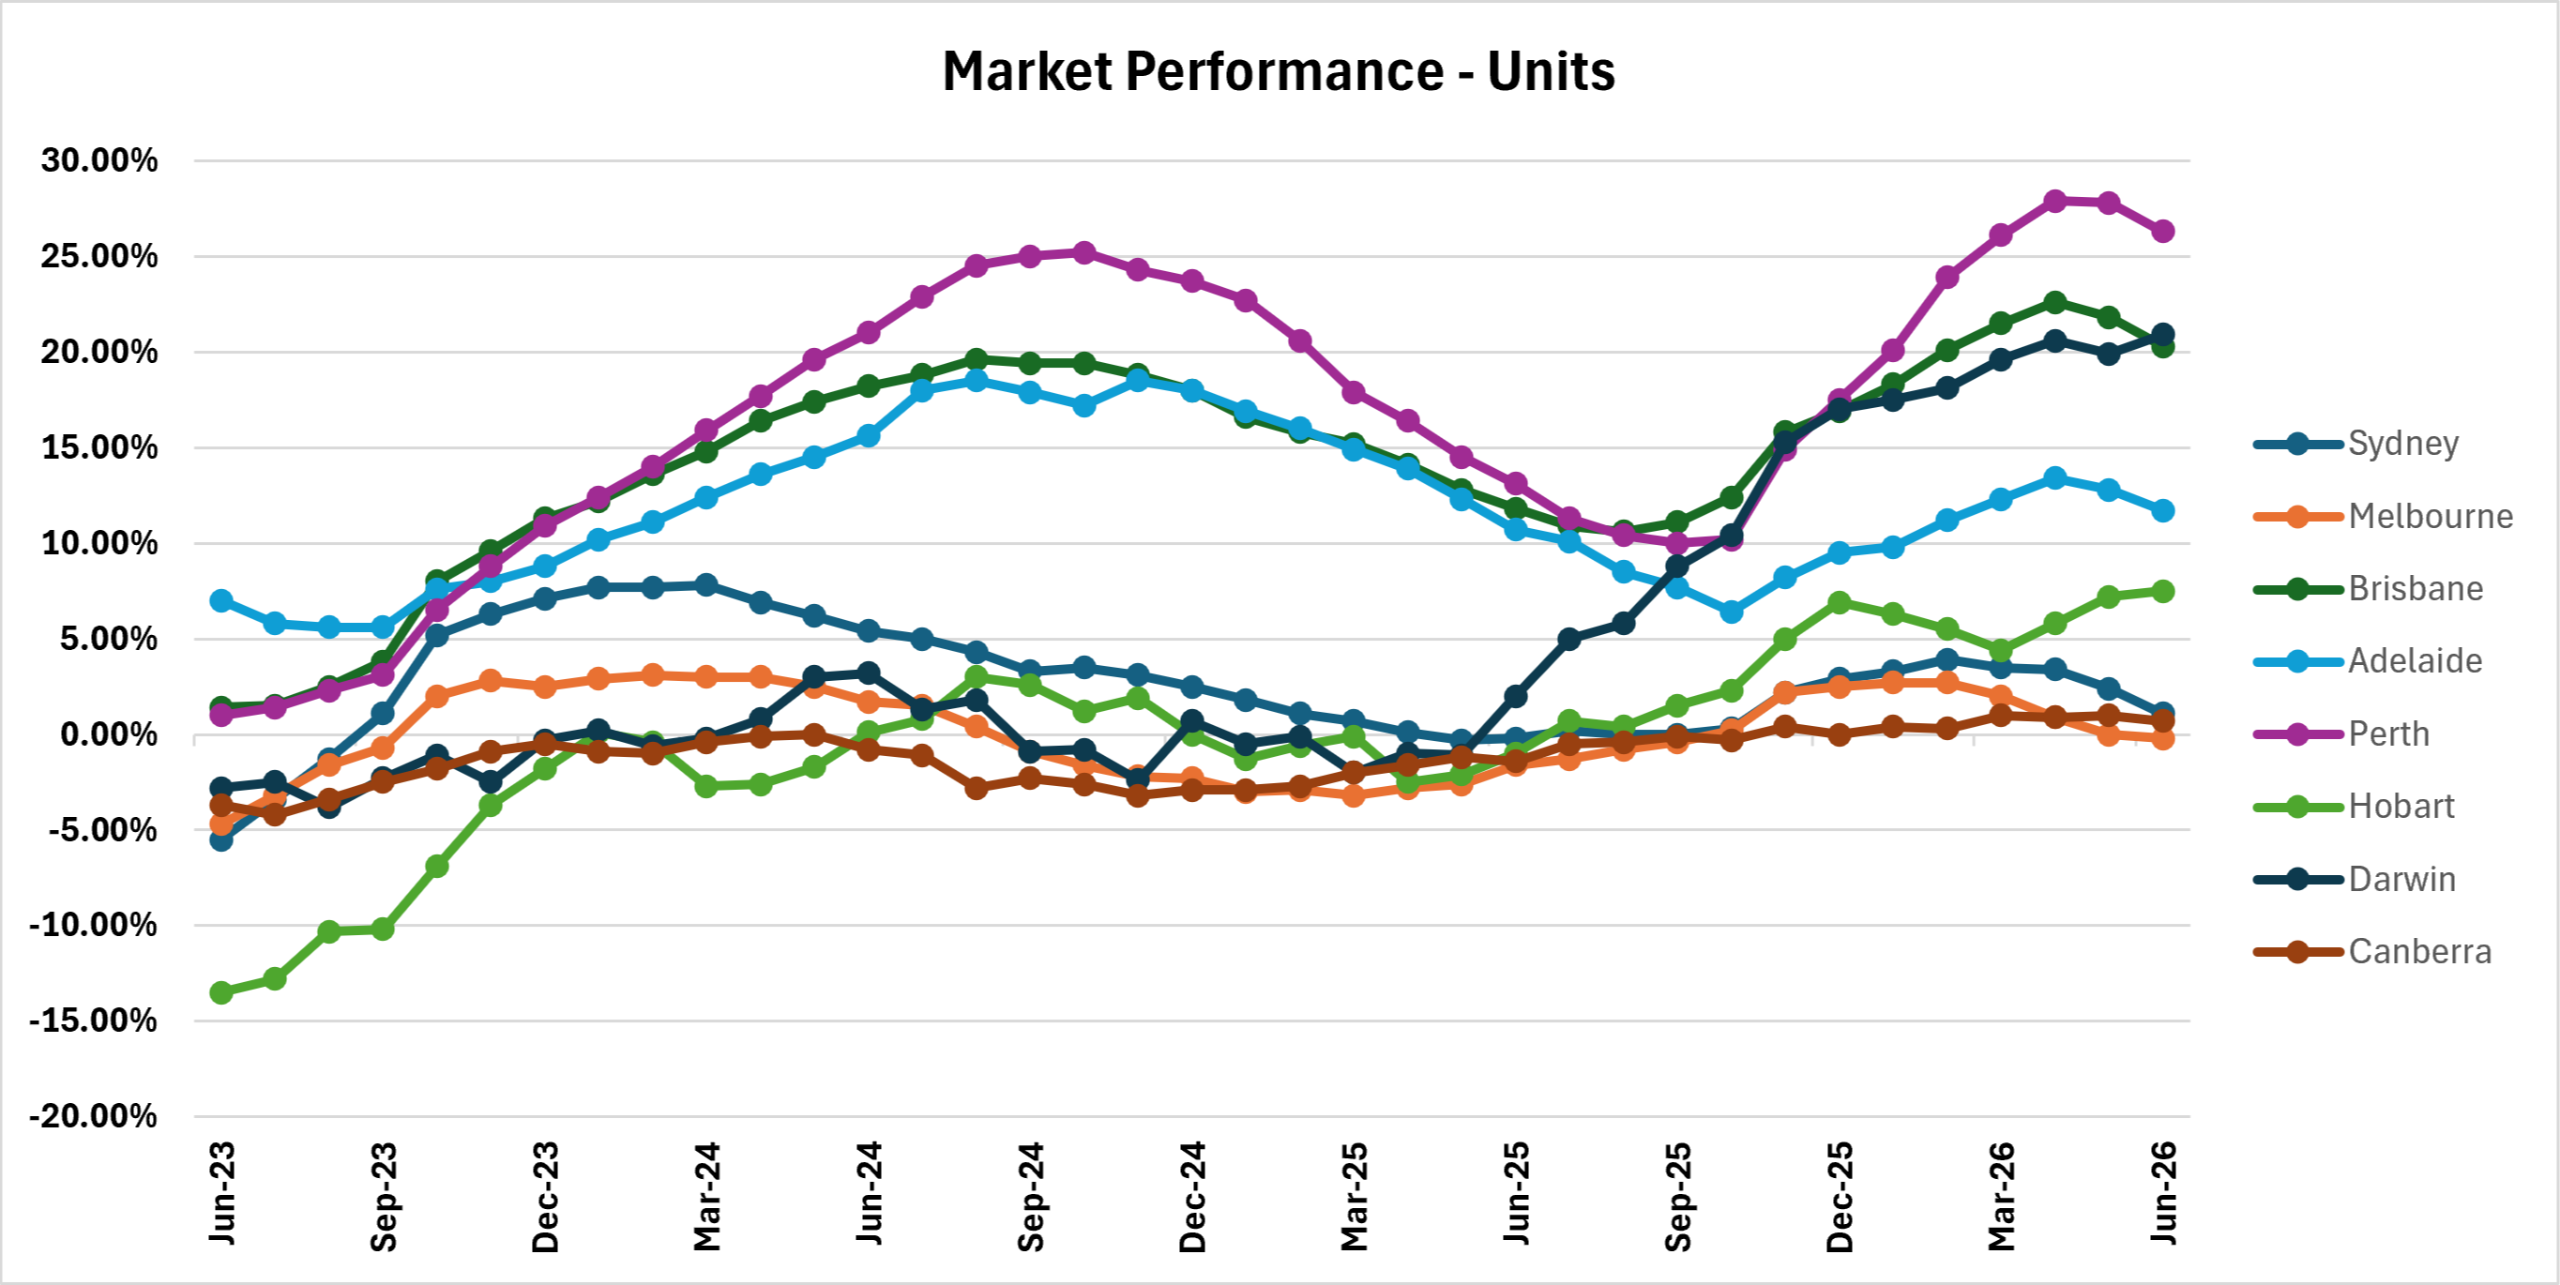
Units – The unit market continued to outperform detached housing across many capital cities during June, reflecting the ongoing search for more affordable property options. Darwin recorded the strongest monthly growth at 1.6%, followed by Perth (0.8%), Brisbane (0.6%) and Hobart (0.4%), while Adelaide posted a modest gain of 0.1%. In contrast, Sydney (-0.6%), Melbourne (-0.4%) and Canberra (-0.2%) all recorded slight declines, although the falls were noticeably smaller than those experienced in the detached housing market. The results suggest that buyers continue to favour units as a more affordable entry point in higher-priced markets, while demand remains strongest in the more affordable suburbs where population growth, rental demand and relative value continue to support prices.
FORECAST
The Australian Property Market wrapped up the financial year in style as the government pushed through one extra change to tax legislation by eliminating the ability for SMSFs to borrow funds to purchase residential property. Given the legislative turmoil, the RBA chose to leave rates on hold, so the market will have clear air in July as the next meeting isn’t until August.
Where's the market heading?
The media is hyping a market downturn, although the changes were minimal in June. But, property prices aren’t useful indicators of where the market will head – prices will only tell you where the market has been and that data is usually around six weeks old.
There’s a range of pointers that show us where the market is heading, though the easiest one to focus on is supply. In June, CoreLogic reported listings (properties advertised for purchase) at 3.8 percent higher than this time in 2025, but still 4.9 percent below the five-year average.
Owners take time to make the decision to sell, and then it can be six to eight weeks before a property will be released to the market, so we’re expecting a bump in supply in the next few months.
We’re definitely expecting a market correction, though home buyers (not just first time buyers) will hold many areas of the market up, so don’t be trapped by expecting price dips across the board. However, it’s markets like these where real opportunities emerge [this means there will be true bargains for those in a position to buy]. Strong negotiation skills alongside quality due diligence will be crucial for optimum results.
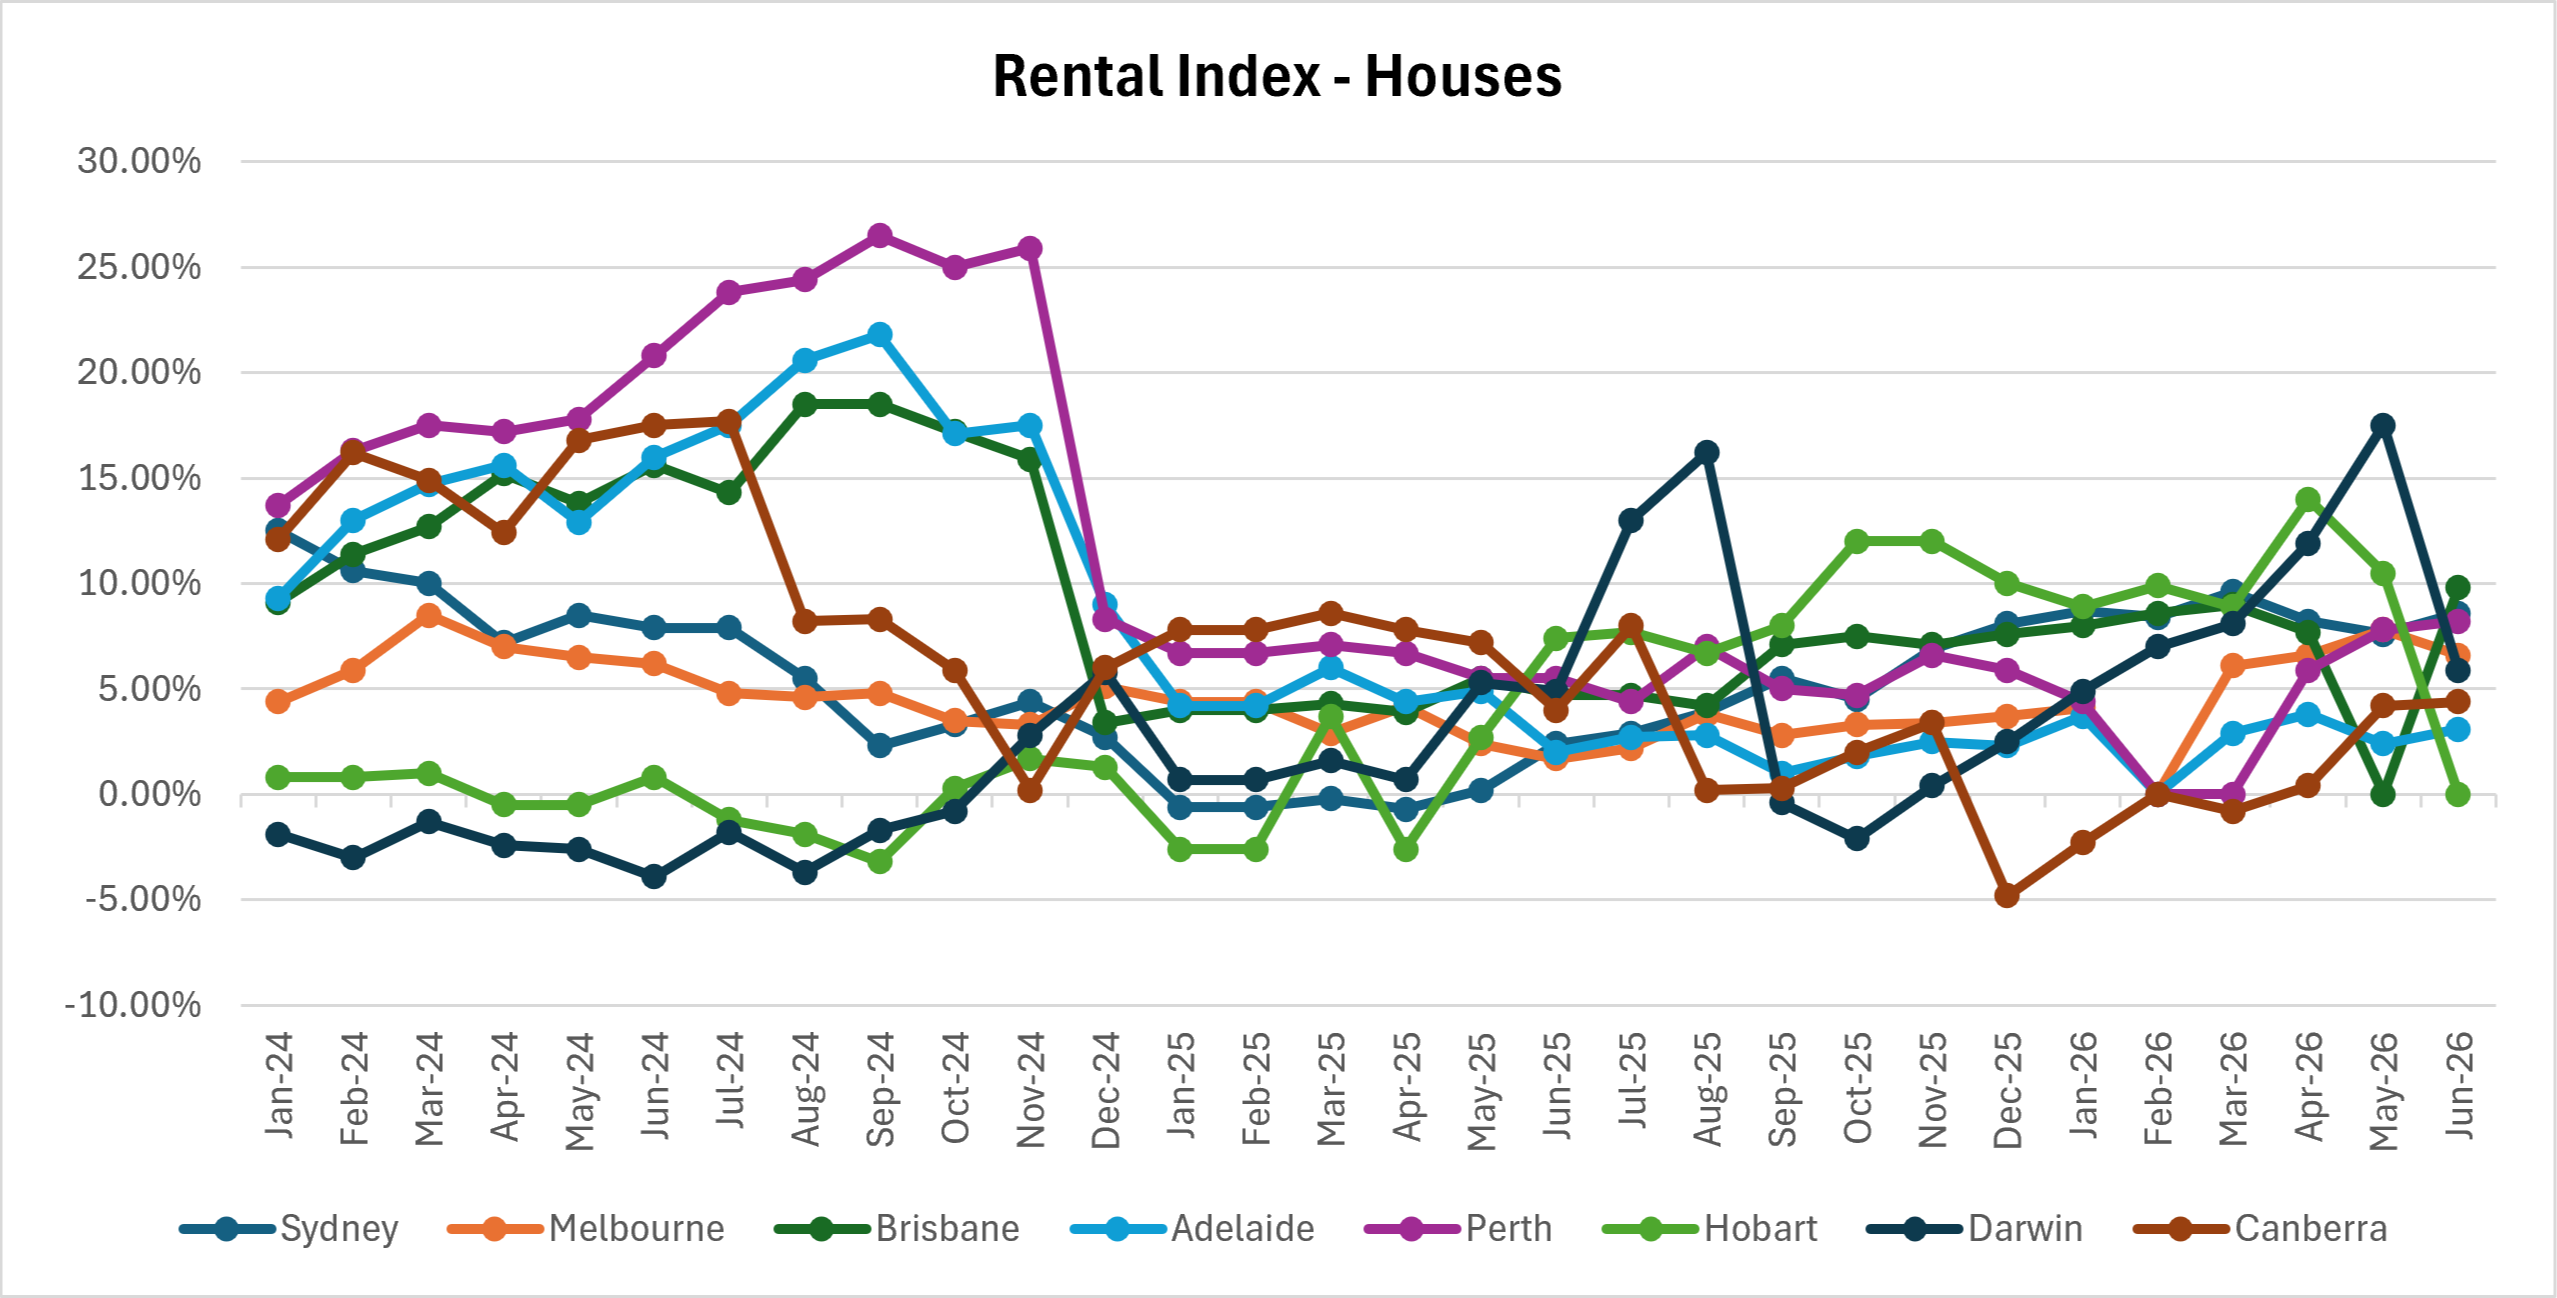
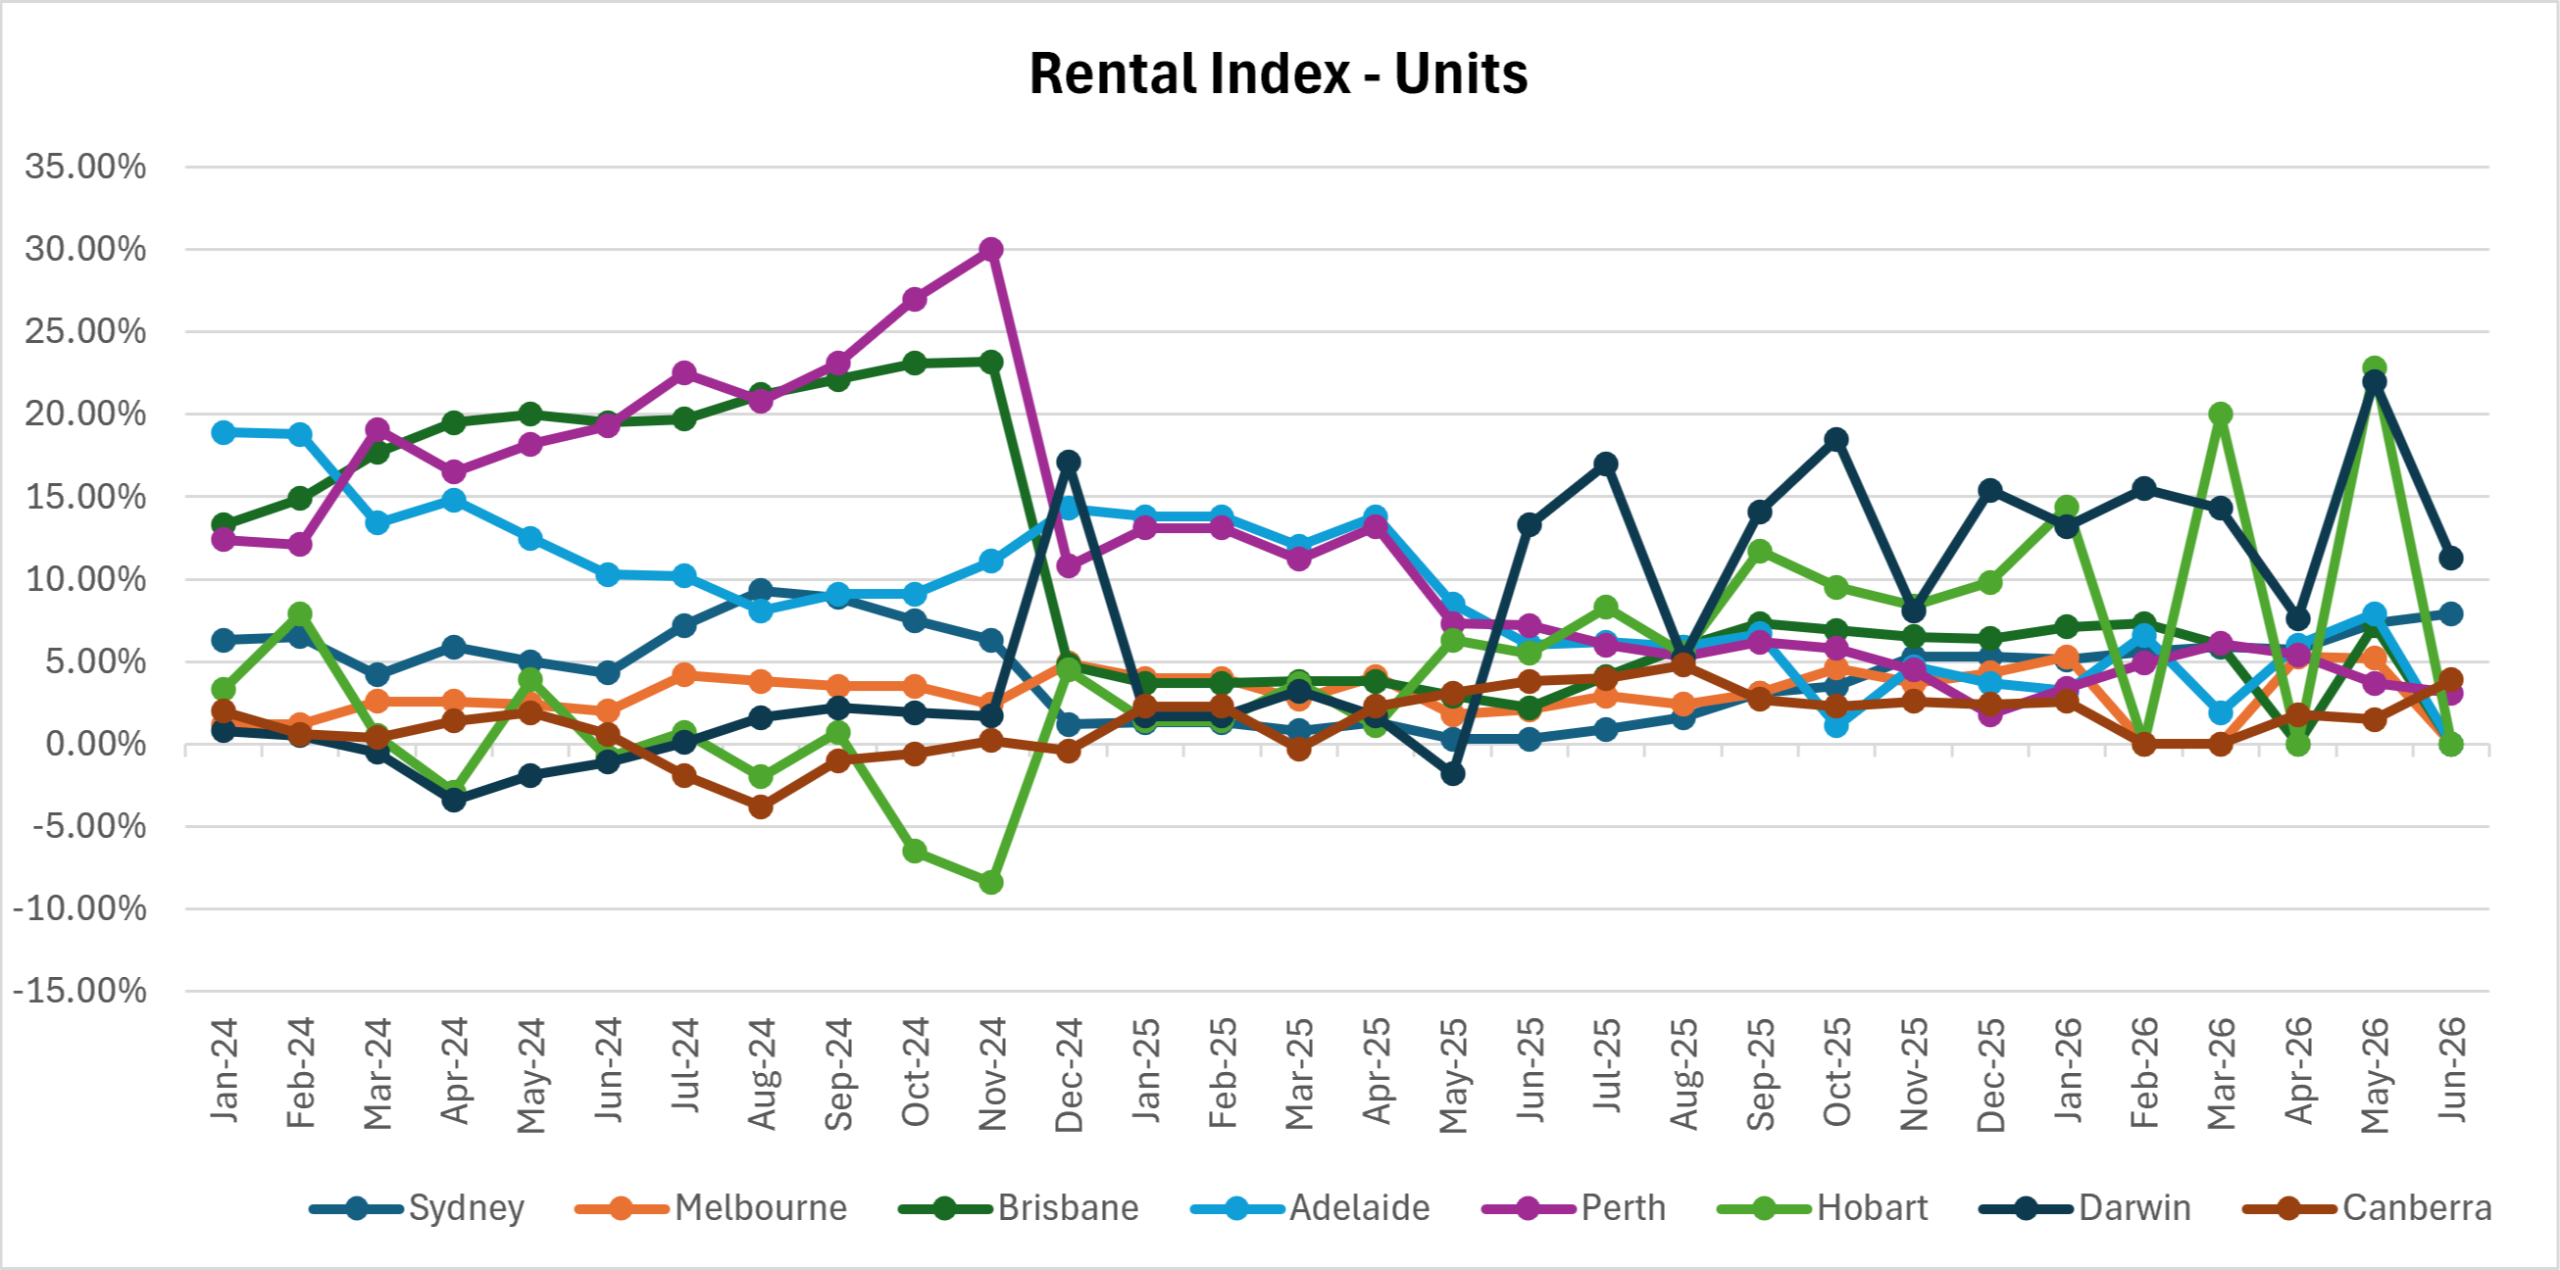
Rents - Houses v Units
Once again, please note the graphs below show ‘price changes’ not actual pricing [eg – even though one area looks to be ‘on top’ this means it’s increasing faster than other locations, not that it’s more expensive.] Overall rents look to be stabilising, with very minimal change over the past couple of months.
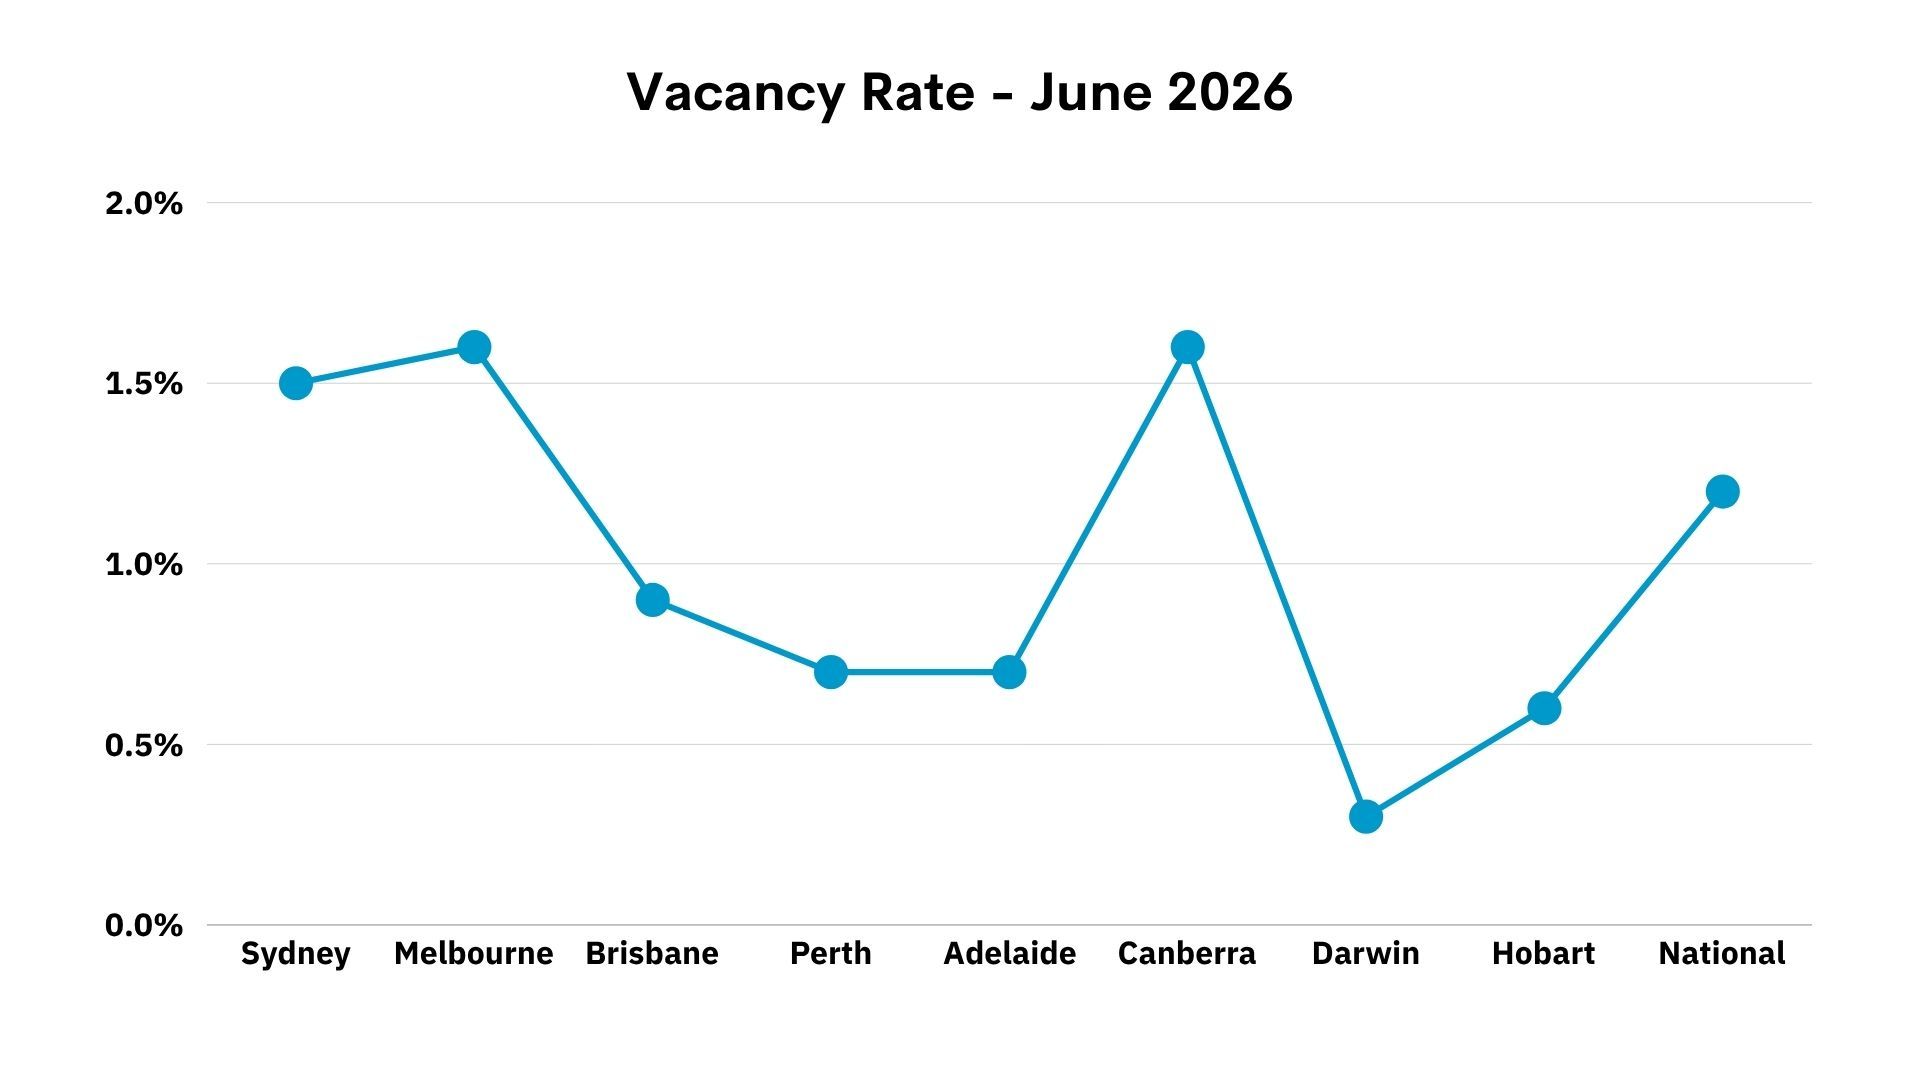
Vacancy Rate
This data is drawn from SQM Research. It represents the total vacancy rate in each major city. A ‘healthy’ rate is around 2.5%. Anything below this means the amount of properties available for rent is not sufficient to meet the amount of people who want to rent in that particular area. As you can see, all areas of Australia need more rental properties (all areas are under 2%), although supply is getting closer to healthier levels in Melbourne and Canberra.
Employment
Employment levels are an important indicator of economic health, and something the RBA monitors closely when deciding what to do with interest rates. This information should also be monitored by property buyers as a leading indicator of locations to avoid or consider for their next purchase.
The sweet spot for a good level of unemployment – where there’s enough jobs for those who want them - will hover between 4 and 5% depending on the rate of jobs turning over.
Anything below 4% would be considered to be low unemployment and would suggest a strong jobs market, attracting workers which increases demand for housing and pushes capital growth and rental returns upwards.
Anything in the 4.5% and upwards would reflect high unemployment which will indicate economic struggles, leading to weaker property price growth and eventually declines.
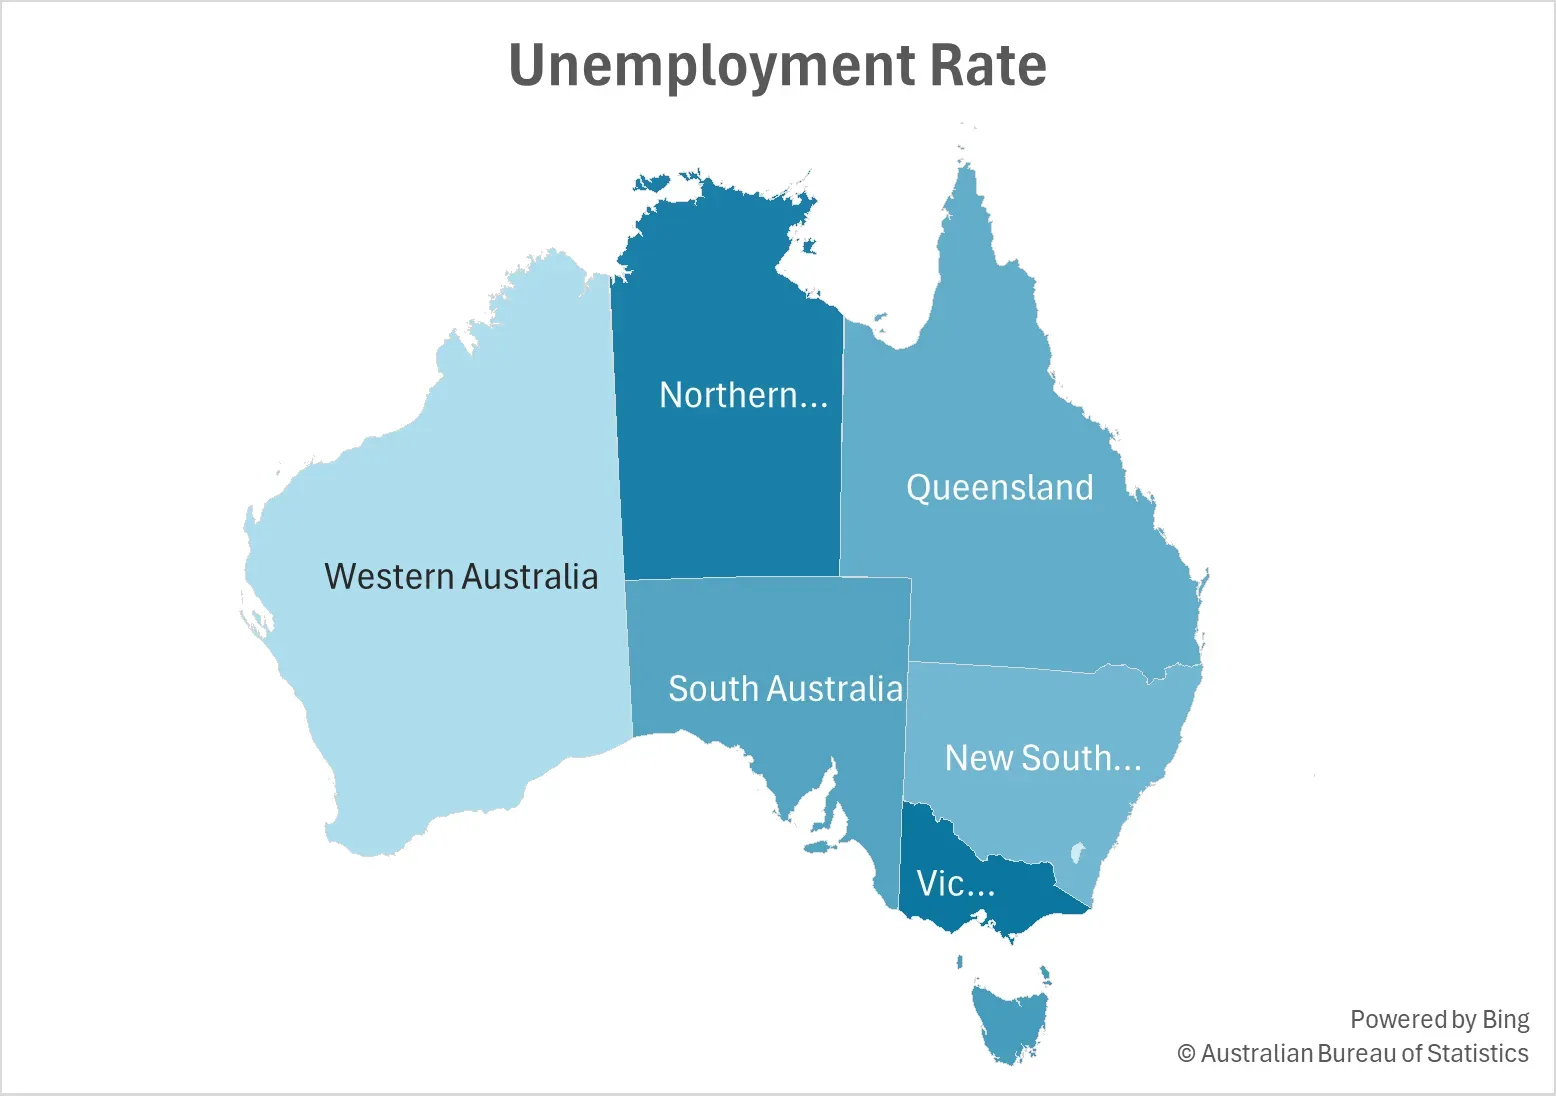
| New South Wales | 4.30% |
| Victoria | 4.90% |
| Queensland | 3.70% |
| South Australia | 4.20% |
| Western Australia | 4.60% |
| Tasmania | 5.30% |
| Northern Territory | 4.60% |
| Australian Capital Territory | 4.00% |
| Australia | 4.40% |
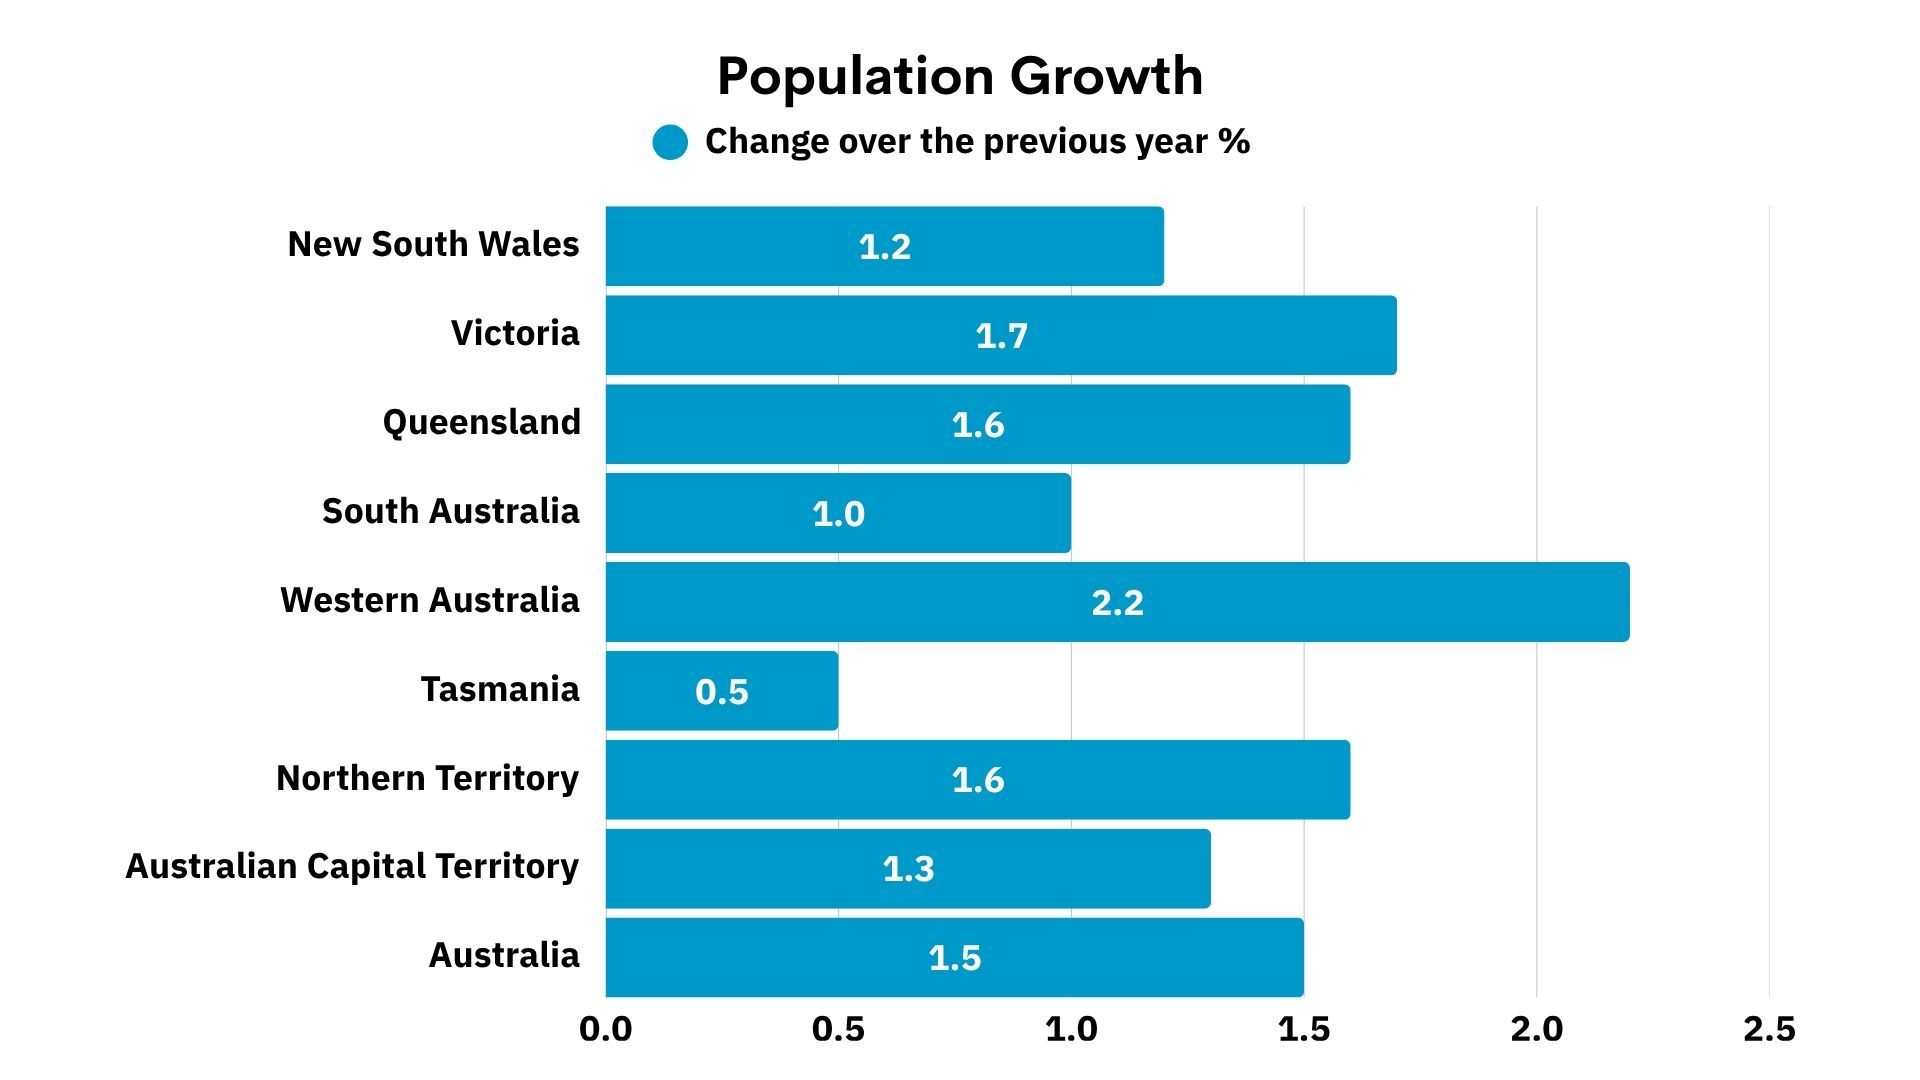
Population Growth
This graph shows the change in population by State over the last reporting period. The data includes changes caused by both overseas migration and also where Australians are moving from one state to the other. Overall Australia had 306,000 migrant arrivals in 2024 -2025, a slight decrease over the previous 2023-2024 year of 400,000.
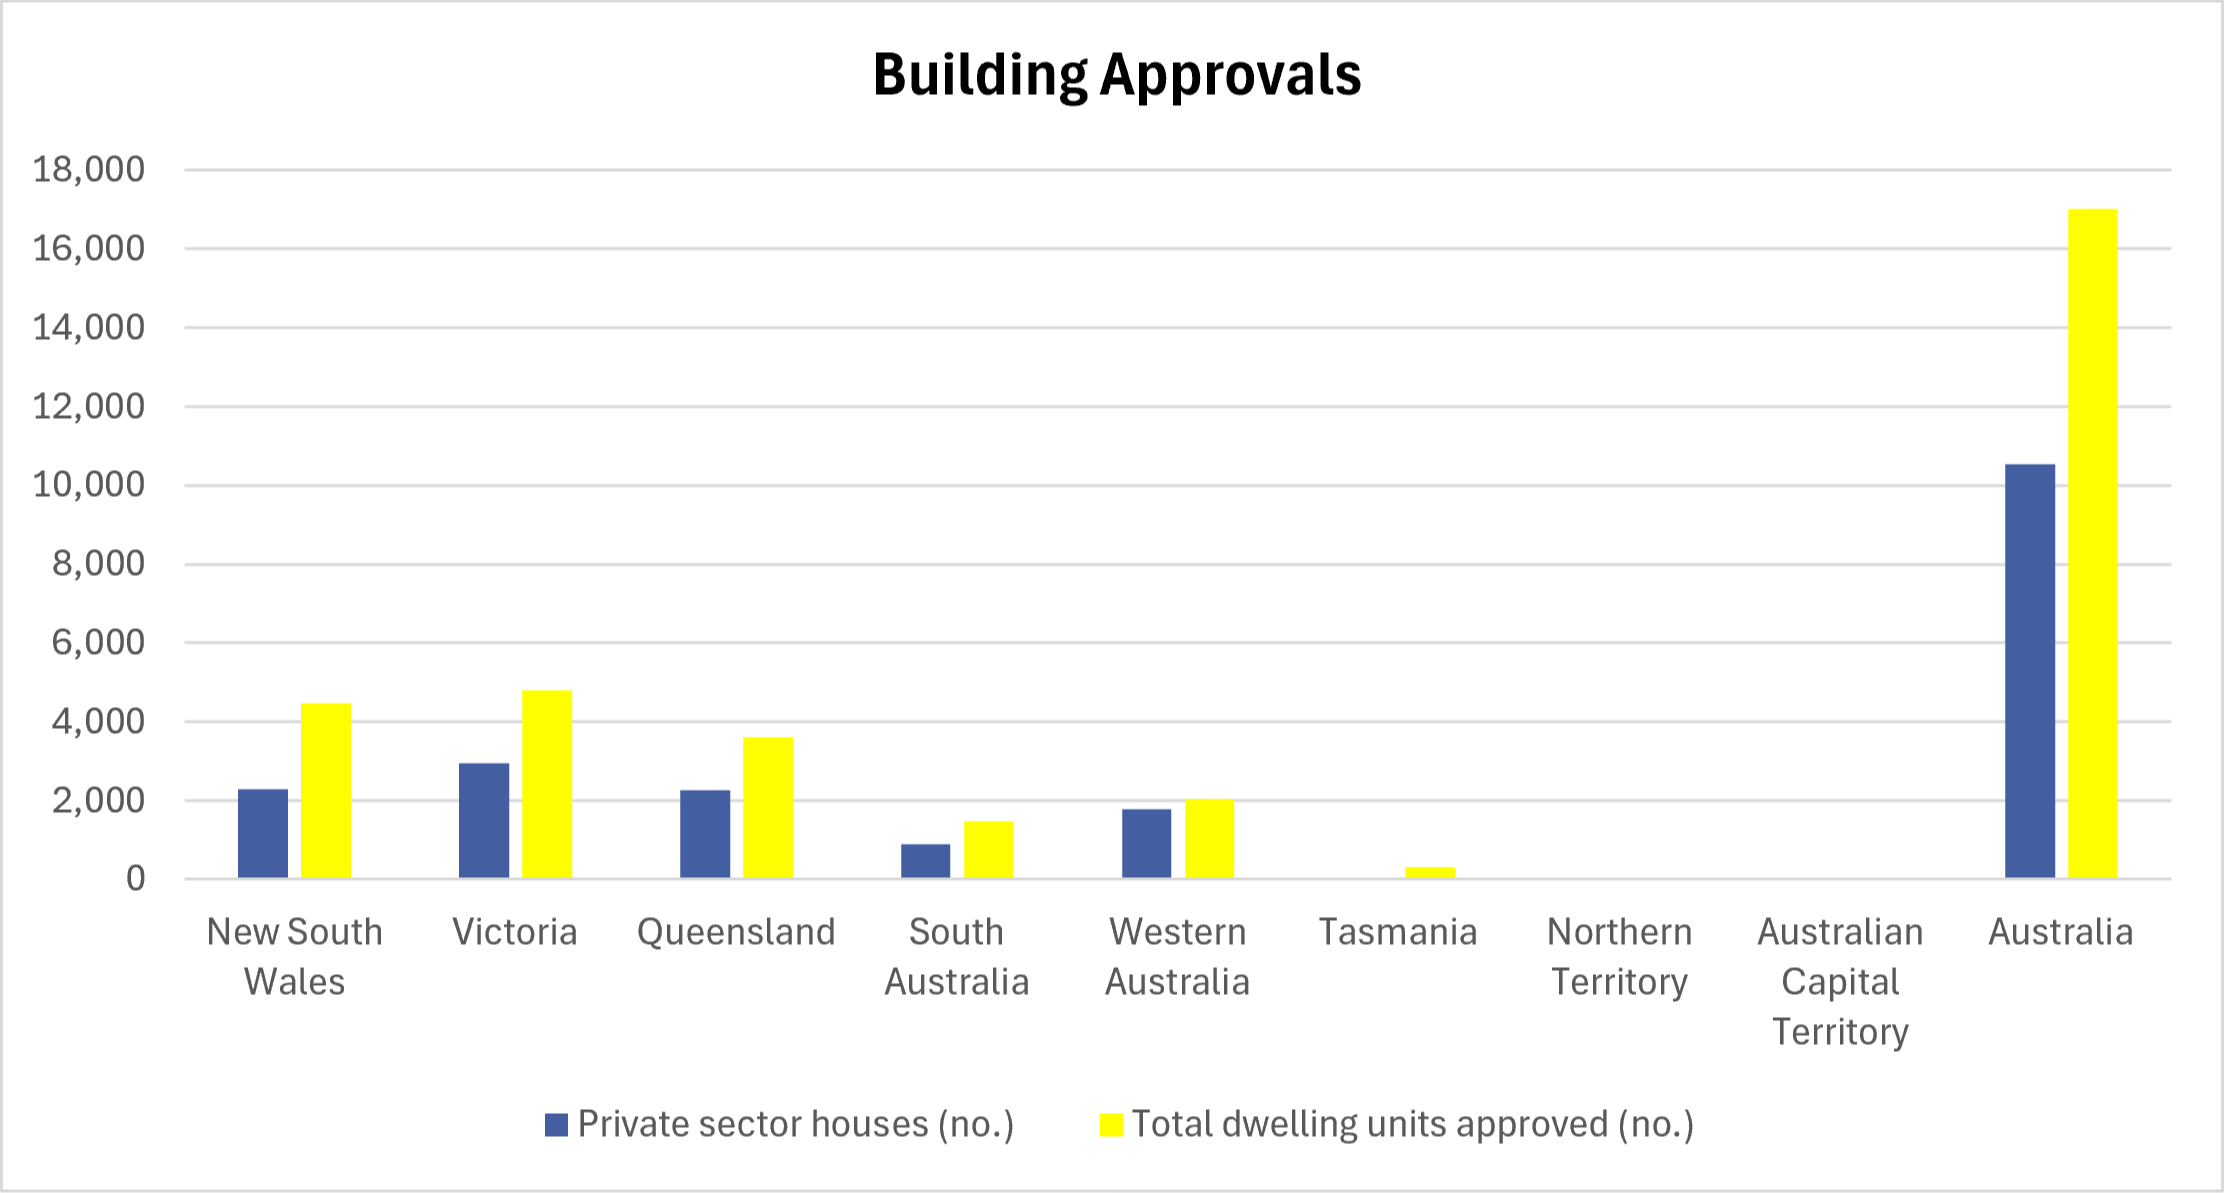
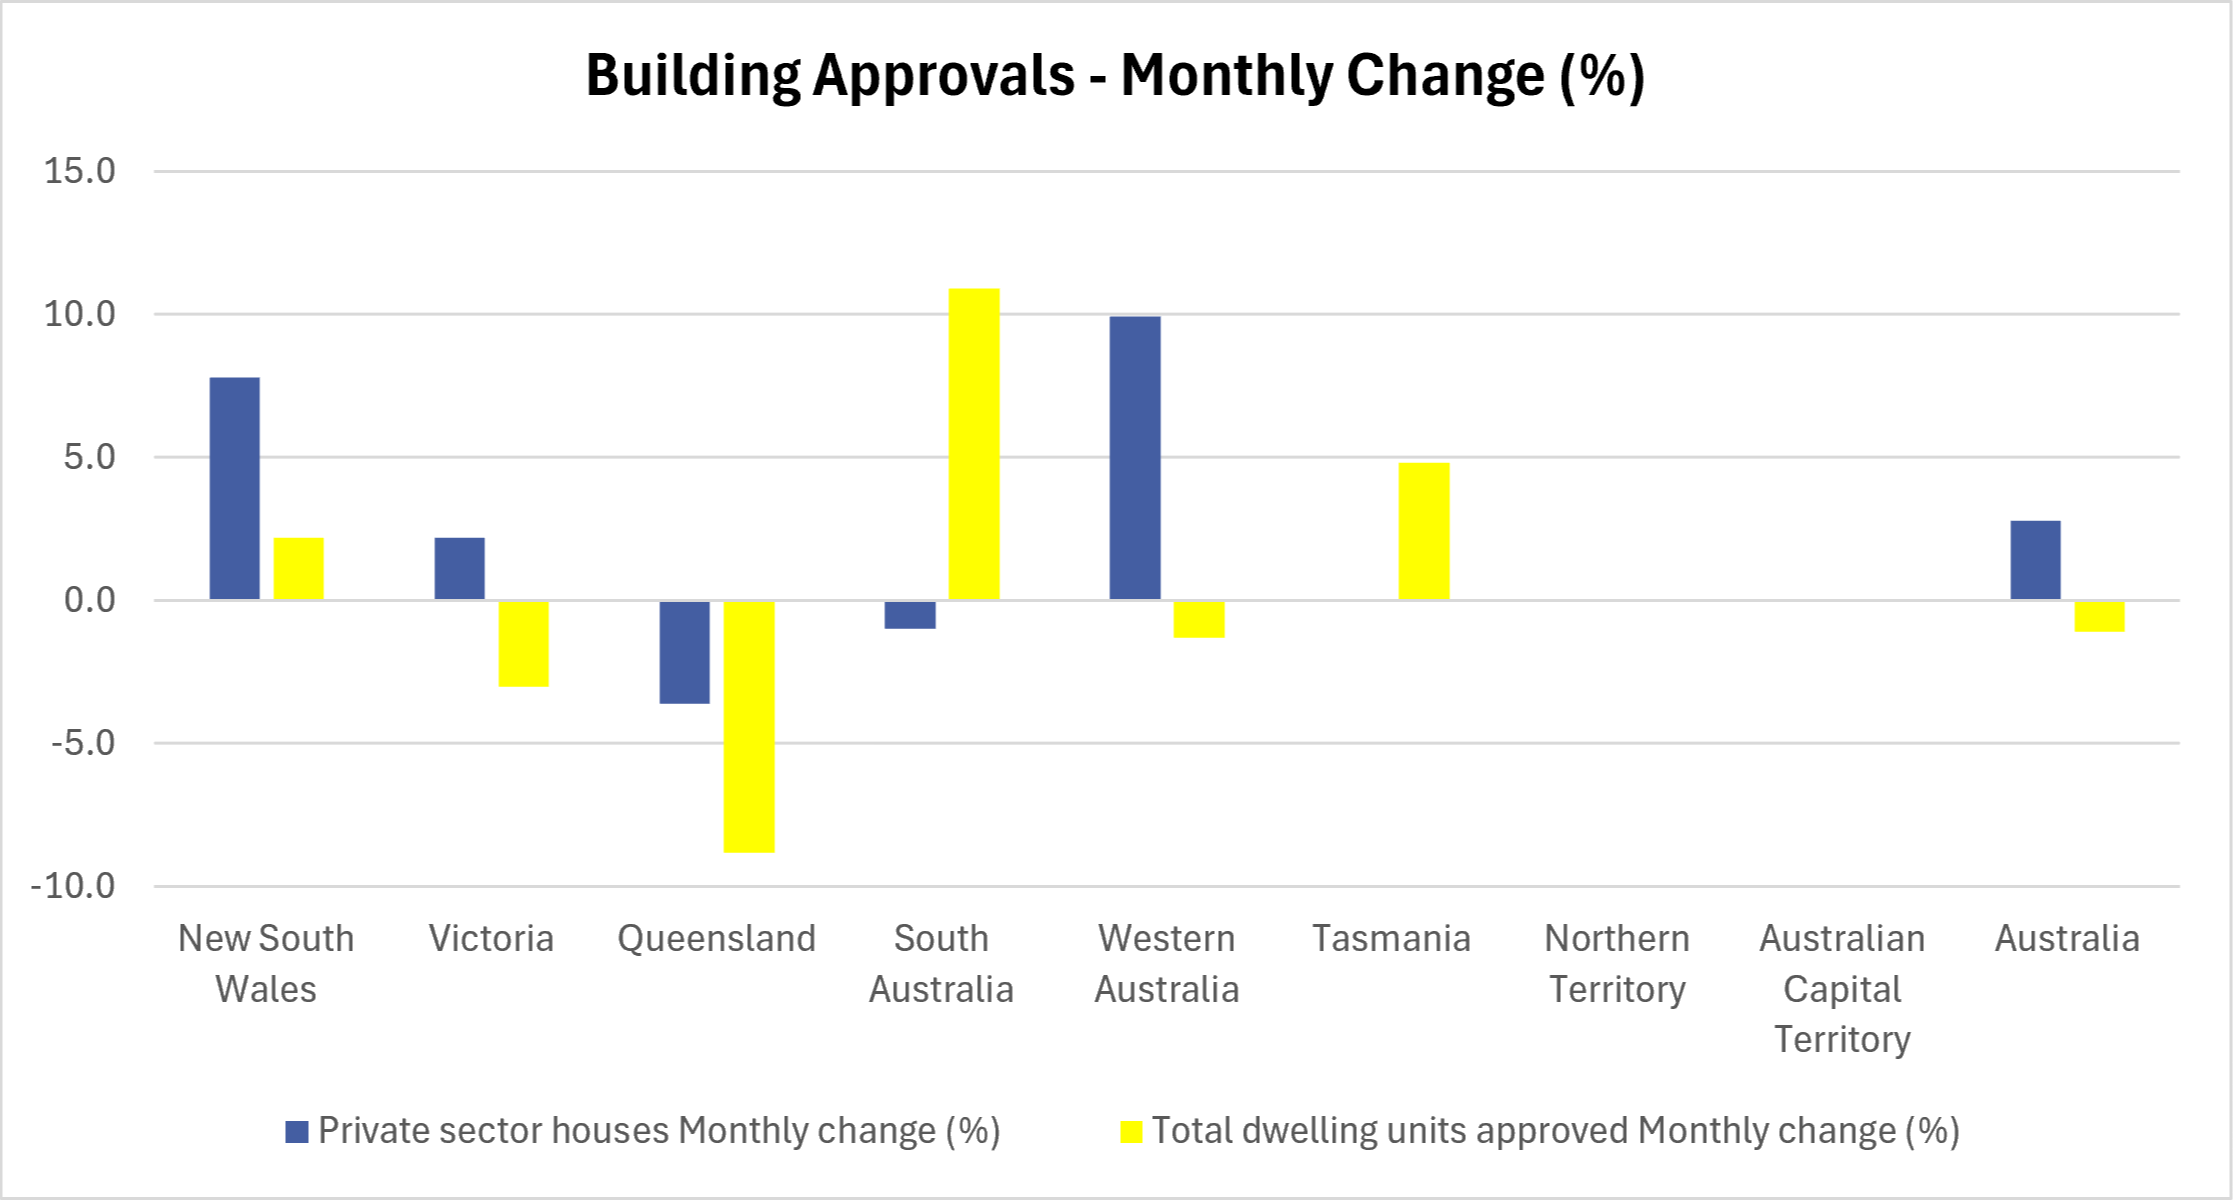
Building Approvals
The graphs below show the monthly dwellings approved in each State and Australia-wide, and also the percentage change. In 2024, the Australian Federal Government announced a target of delivering 1,200,000 homes by 2029 and to achieve this we need to build 240,000 dwellings (houses and units) per year. As you can see, we’re falling drastically behind on this target.
RBA Cash Rate (Interest Rate)
4.35%
Australian Dollar
1 AUD = 0.69 USD
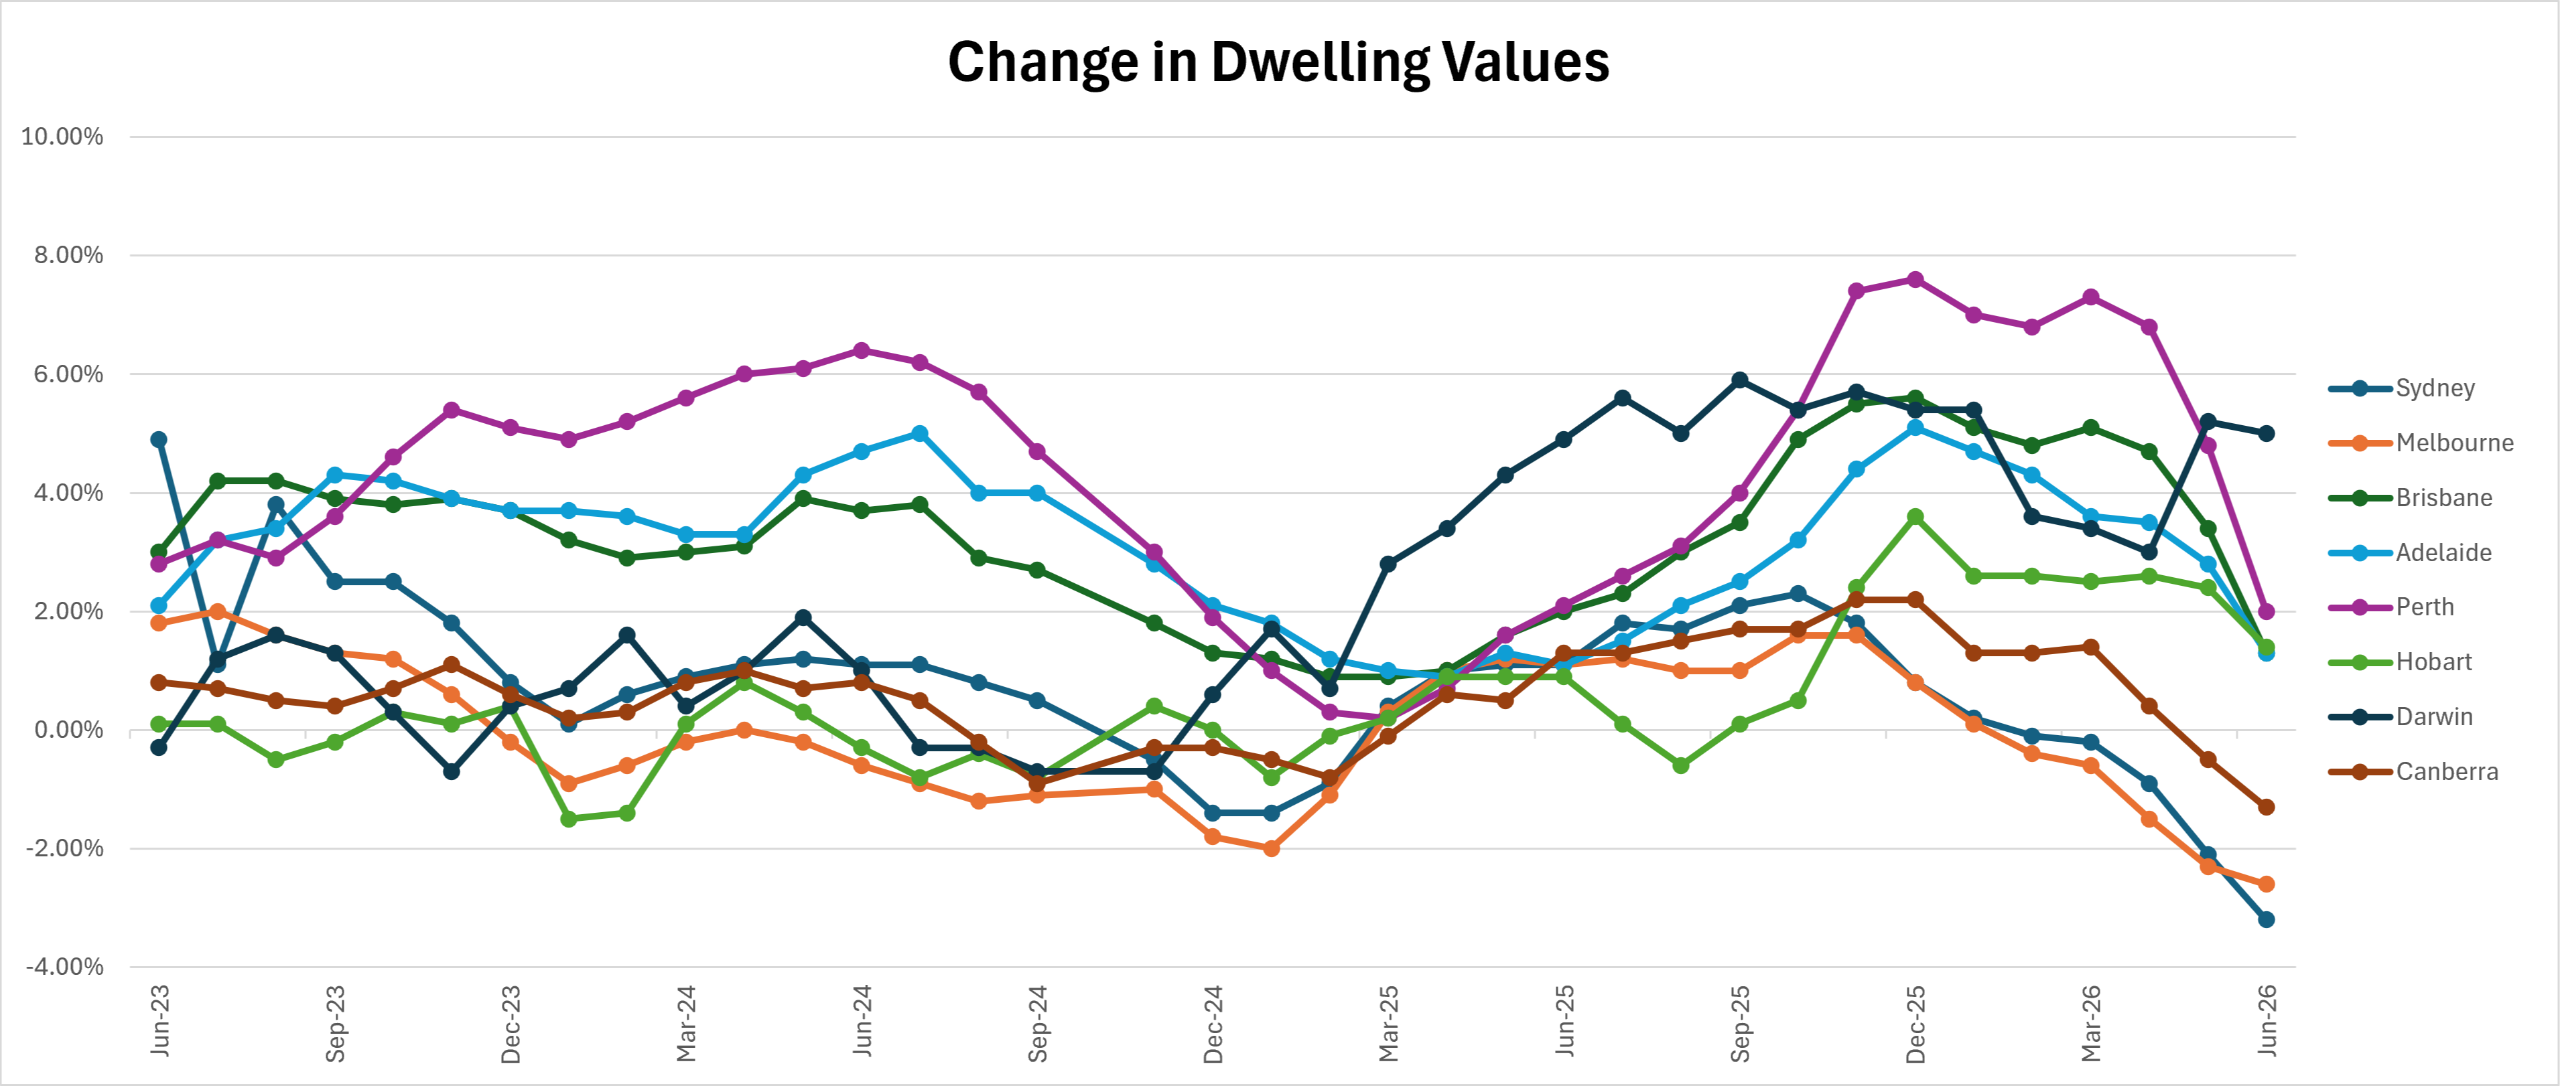
Dwelling Values Trend Line
The graph above shows the price trend line for houses and units combined. While this information is useful, it’s important to remember to look at pricing at suburb level and review pricing for your specific property type in order to identify opportunities and know what price to offer for your next purchase.
The combined dwelling market continued to reflect the two-speed nature of Australia's property market during June. Perth remained the strongest-performing capital city with monthly growth of 0.7%, closely followed by Darwin (1.4%) and Hobart (0.6%), while Brisbane also recorded a modest increase of 0.3%. Adelaide was unchanged over the month, suggesting its period of exceptionally strong growth may be beginning to stabilise. At the other end of the spectrum, Sydney (-1.2%) and Melbourne (-1.0%) both recorded declines, highlighting the softer conditions emerging in the larger eastern capital cities, while Canberra also eased by 0.6%. Overall, the June figures reinforce that market performance continues to vary significantly across Australia, with affordability, local economic conditions and buyer demand remaining the key drivers of growth.
Of course, in order to be successful, where you buy depends on your personal requirements as well as what’s happening in the market so book in for a Property Clarity Chat if you would like more tailored, personal recommendations.
If you’re looking for a more detailed review of the market, check out the information below.

In this Market Watch June episode, Debra from Property Frontline is joined by new build specialist Scott Hochgesang and mortgage broker Darryl Mutch from Mutch Financial Services to unpack how the latest data to 31 May 2026 and how the Federal Budget tax changes are reshaping Australia’s property market. They break down price movements across Sydney, Melbourne, Brisbane, Adelaide, Canberra, Perth, Hobart and Darwin, and what’s really happening on the ground across different price brackets, from sub-$1m buyer hotspots to emerging opportunities in the $3m+ segment. Darryl explains how the federal budget changes are impacting property owners and buyers' access to finance and how this will change the property market in the next six to 12 months. The team also discussed the different approach owners and buyers might take with property due to the changes introduced in the Federal Budget. This includes rental trends, self-managed super fund lending, commercial property options and key strategies for existing investors, new investors, upgraders and tenants navigating the new rules. If you’re planning to buy, build a portfolio or pivot your investment strategy post-budget, this episode helps you understand the real numbers and your next steps.
CONTACT DETAILS
Scott - message him on (m) 0406070005 or / https://www.facebook.com/scotthochgesang.propertycoach
Deb - https://www.propertyfrontline.com.au/book_to_talk
Darryl - https://mutch.com.au/
This episode is hosted by Debra Beck-Mewing, founder of The Property Frontline and creator of the Property Smart Track System, a powerful system for buyers who want to search, assess and buy with skill for themselves in the current market conditions.
How We Help
From strategy, through to assessment and purchase of your ideal property - we're here to make your property journey successful and stress-free.
We'll help you :
✅ know what and where to buy
✅ search, negotiate and acquire your property
✅ know what to do next.